
Intervention: Caffeinated Beverage + Carbohydrates + Electrolytes (CAF+CE, Liquid I.V. Energy), Caffeinated Beverage + Electrolytes (CAF+E), Caffeinated Beverage (CAF) or water. More information about the study products can be found in the published article.
Methods: All participants (n = 28) completed the three active arms (CAF+CE, CAF+E and CAF) and the water arm of the protocol. Body mass measurements and urine were collected at 0-, 60-, 120-, 180- and 240-minutes post-ingestion of the test beverage. Beverage Hydration Index (BHI), urine output and net fluid balance were evaluated. Participants' habitual caffeine intake was used to stratify users into occasional (<25 mg/day) or regular users.
Study Duration: 240 minutes
Eligibility Criteria:
- Healthy adults (14 men, 14 women).
Key Findings
1
Beverage Hydration Index: Both the CAF and CAF+E beverages had lower BHIs relative to water and CAF+CE (P = 0.001, P = 0.007). Meanwhile, CAF+CE did not differ from water at 120 min (p = 0.53) or 240 min (p = 1.0). Although the mean and median BHI values for CAF+CE were <1.0 at 120 min, they were not significantly lower than 1.0 (P = 0.089).
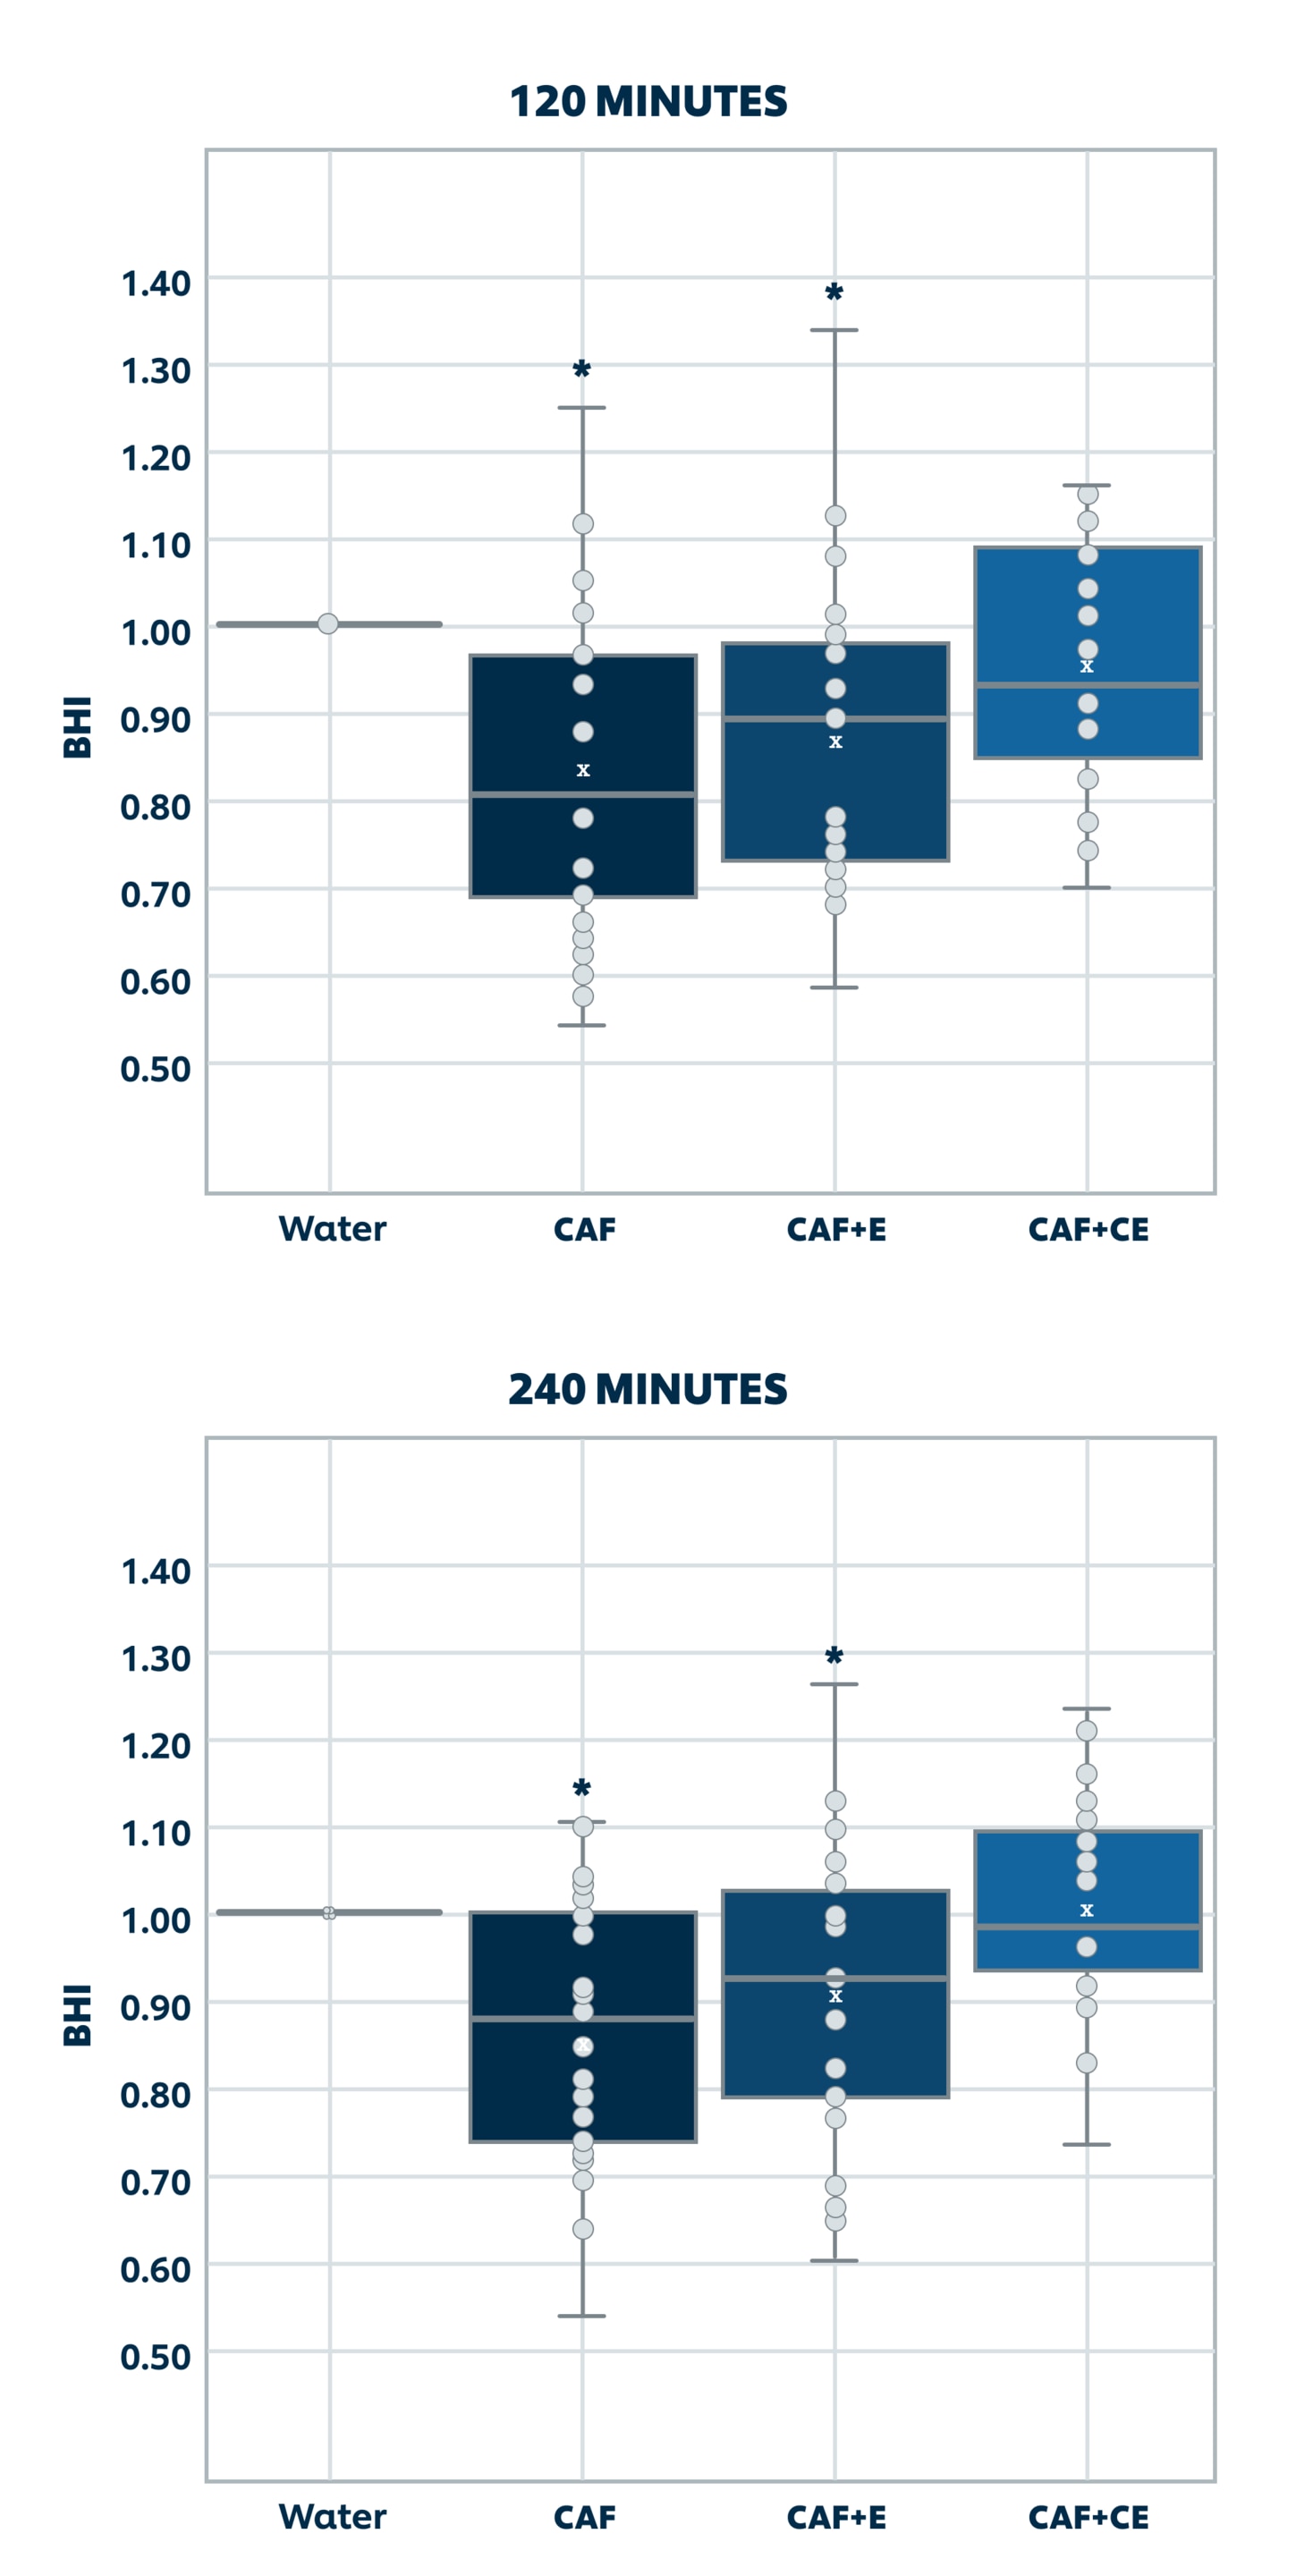
Beverage Hydration Index for the four tested beverages. Left: 120 minutes. Right: 240 minutes. * = Lower BHI for CAF and CAF+E vs. water and CAF+CE (P<0.001). Adapted from Millard-Stafford et al., Caffeinated Energy Drink Formulations Differentially Impact Hydration Versus Water: Does Habitual Caffeine Intake or Biological Sex Matter? Nutrients (2025), 17, 2913.
2
Sex Effect of Beverage Hydration Index: Women had a 7.7% higher average BHI across all beverages relative to men (P=0.043). For men, the BHIs of water and CAF + CE were greater than CAF and CAF + E (P<0.05). For women, the BHI of CAF + CE was significantly greater than CAF (P<0.05).
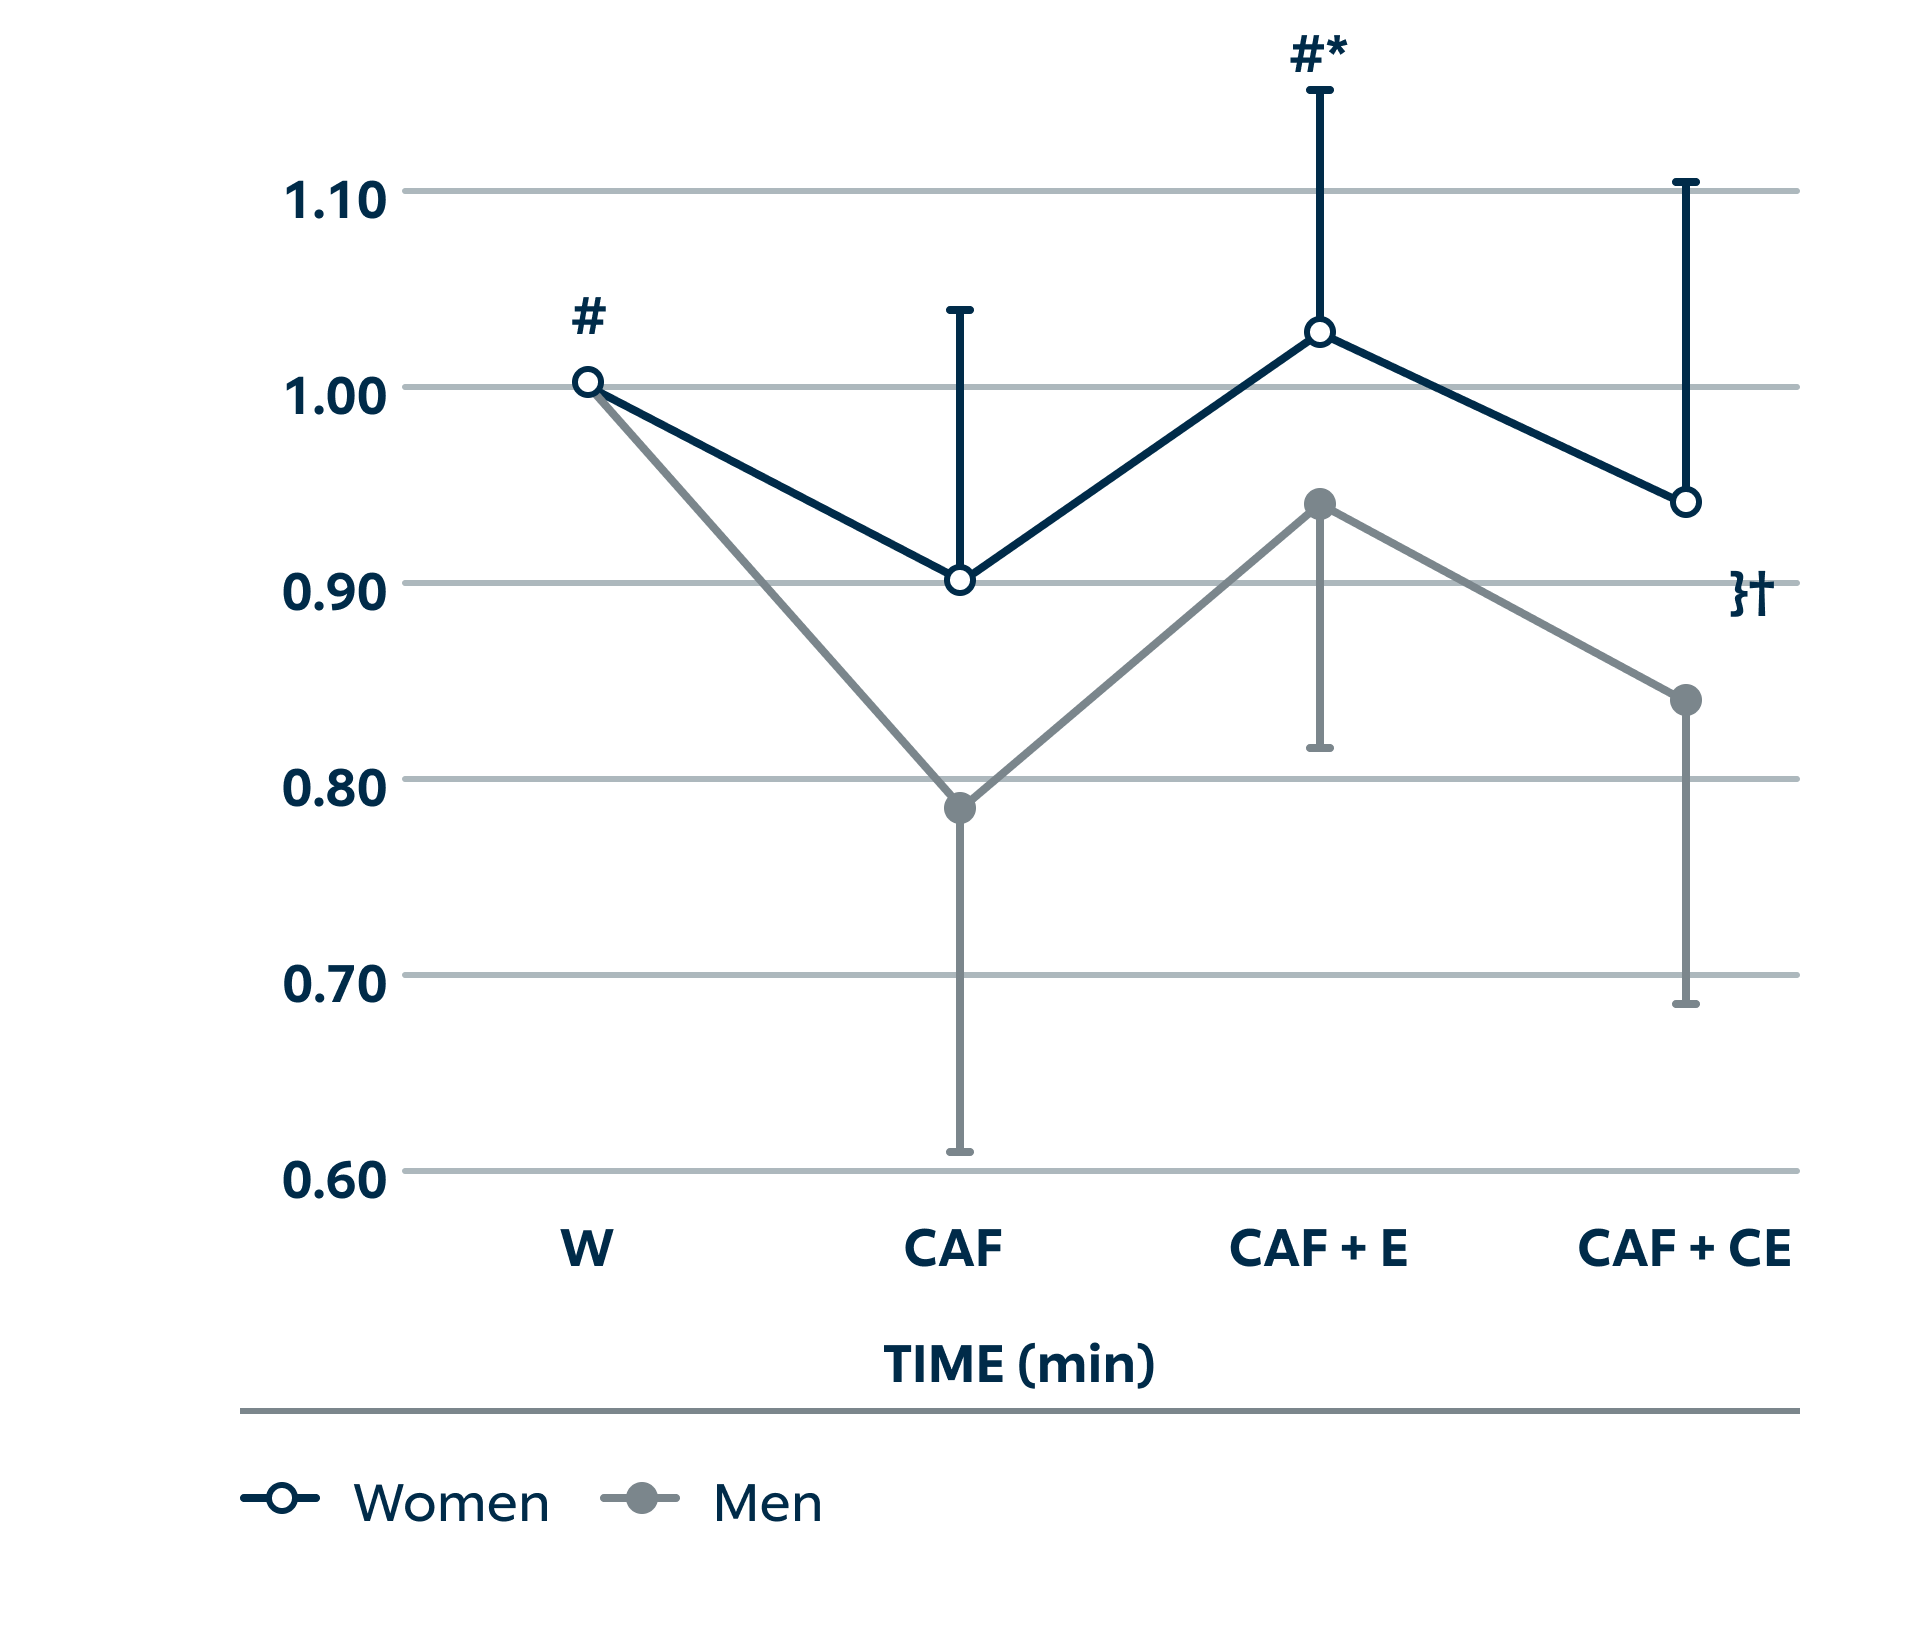
Mean Beverage Hydration Index for the four tested beverages, based on sex at 240 minutes. † = women > men across all caffeinated beverages (P<0.05). # For men, W and CAF+CE > CAF and CAF+E (P<0.05). * For women, CAF+CE > CAF (P<0.05). Adapted from Millard-Stafford et al., Caffeinated Energy Drink Formulations Differentially Impact Hydration Versus Water: Does Habitual Caffeine Intake or Biological Sex Matter? Nutrients (2025), 17, 2913.
This sex effect was attributed to mean differences in BHI observed in CAF, which was significantly reduced in men at the 240-minute timepoint (P<0.001 relative to water). The BHI of CAF+CE was not significantly reduced in either the men or women at this timepoint.
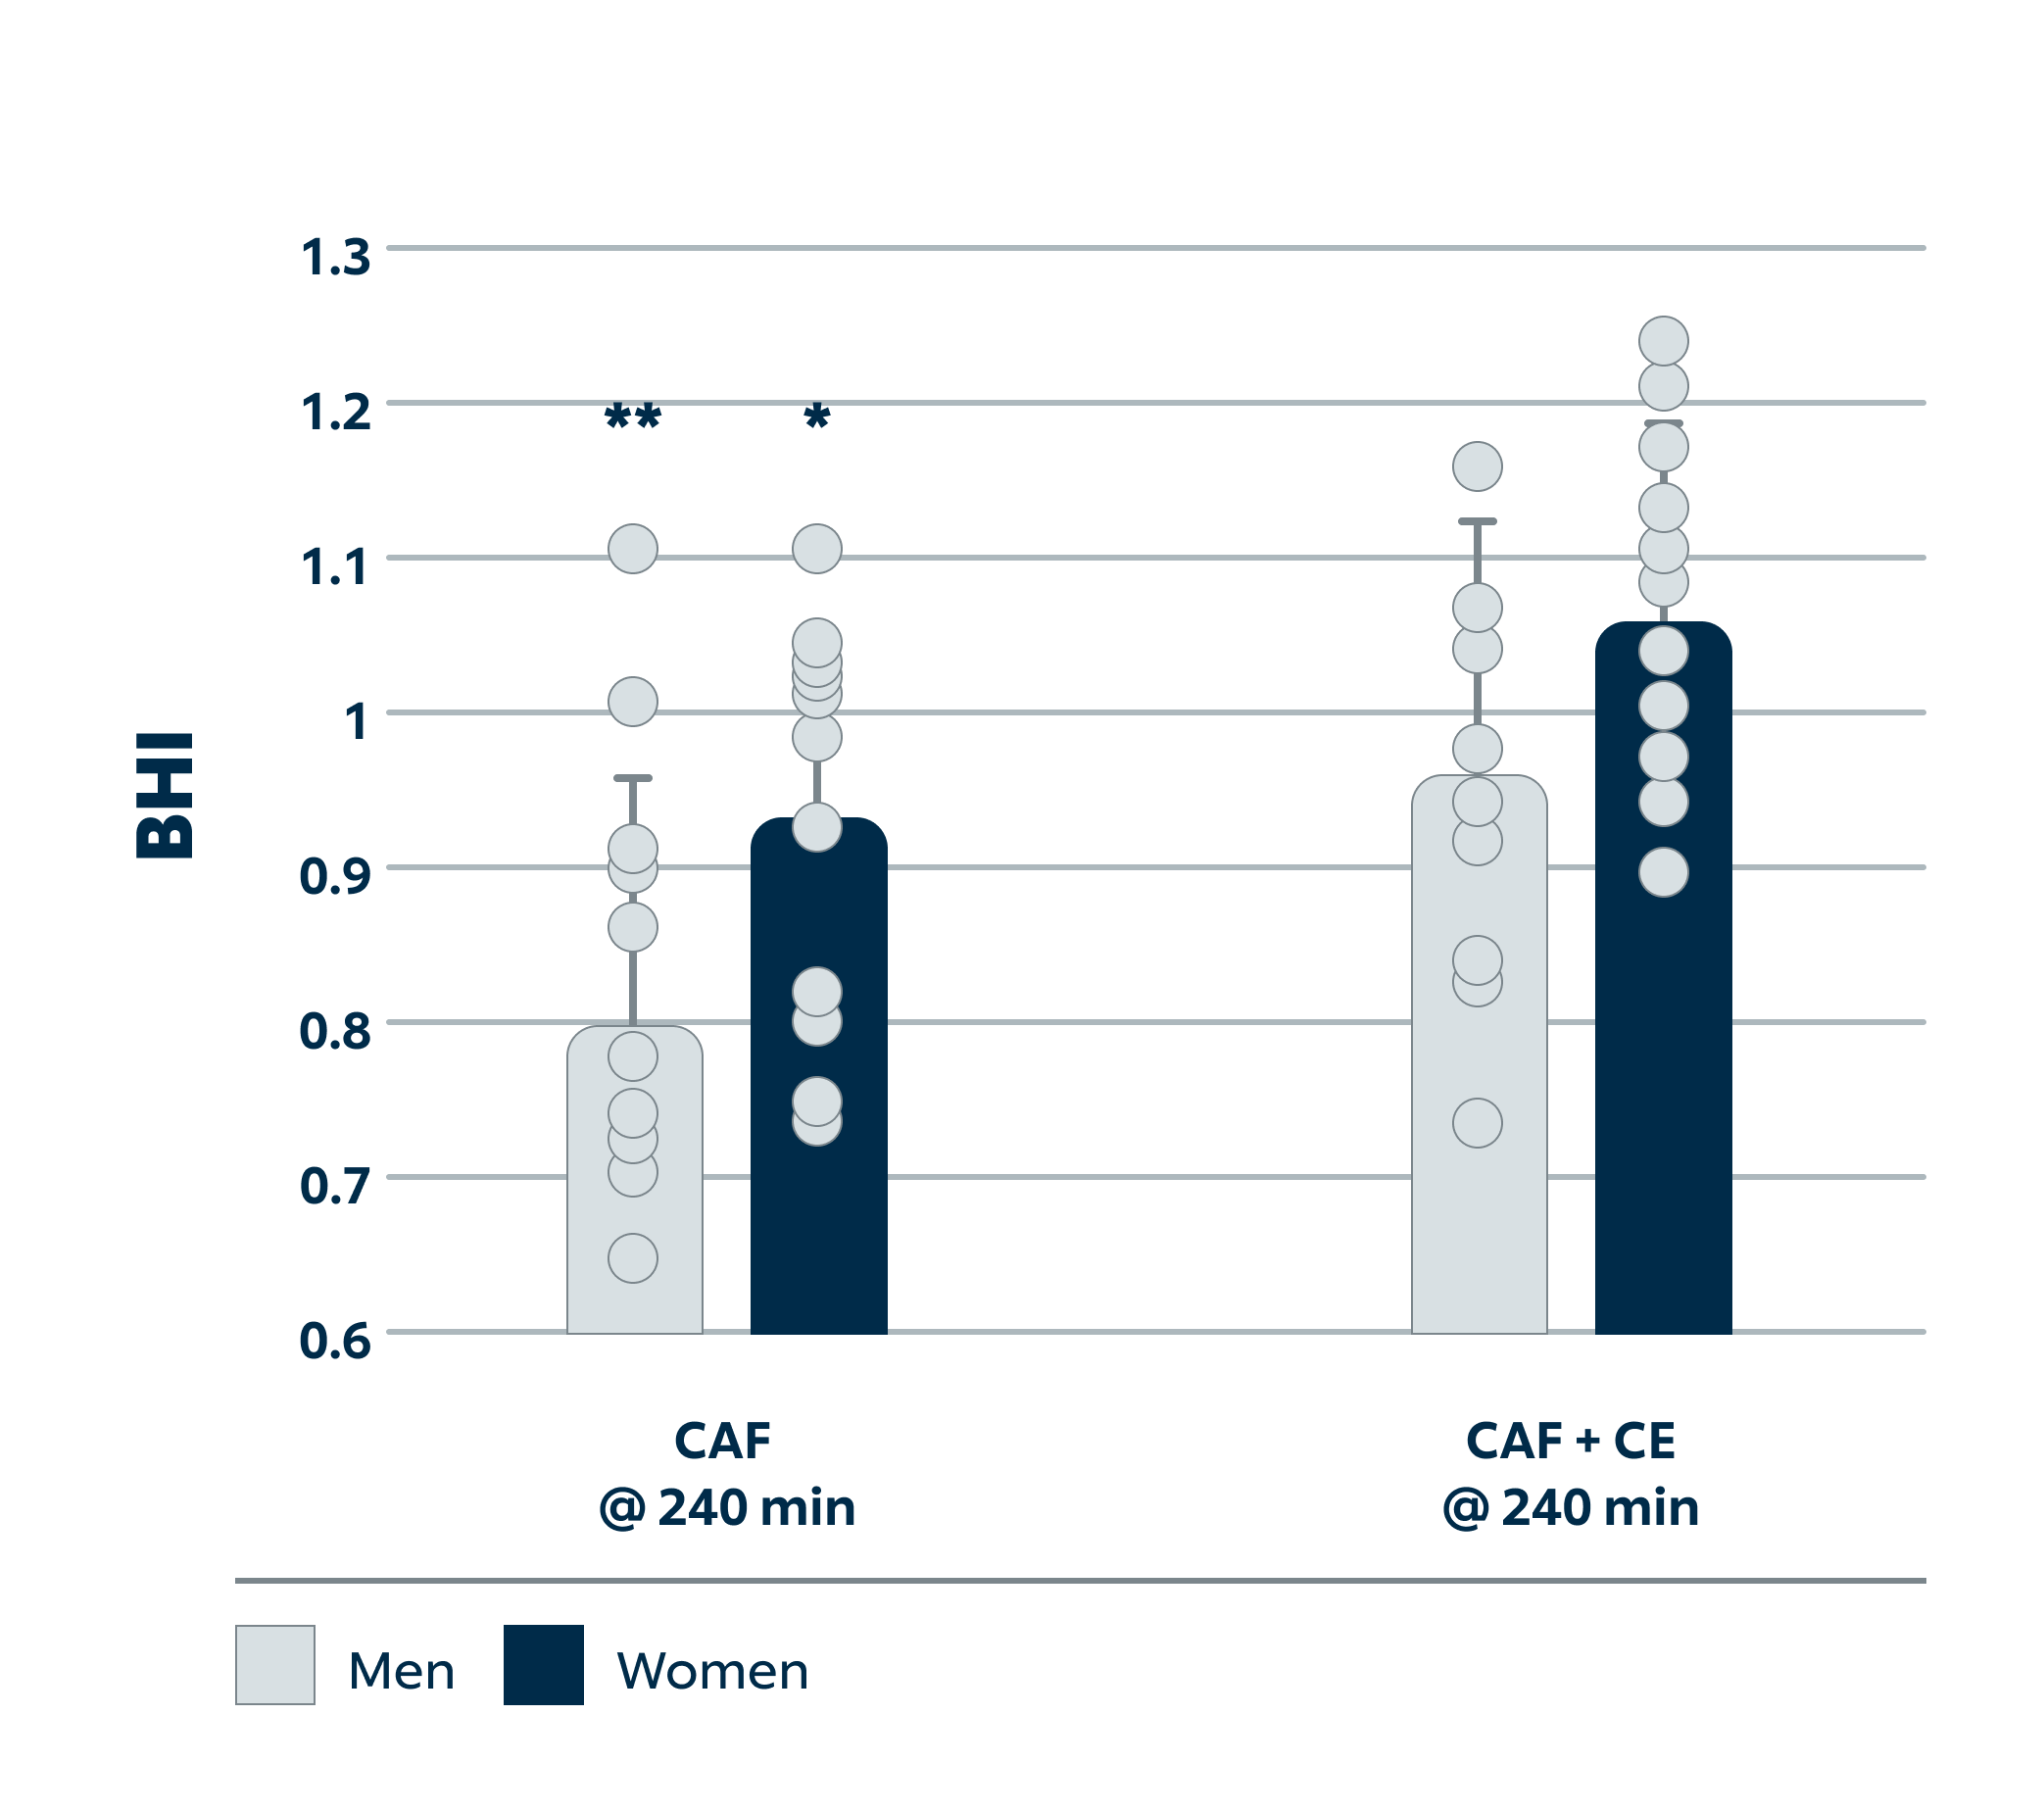
This sex effect was attributed to mean differences in BHI observed in CAF, which was significantly reduced in men at the 240-minute timepoint (P<0.001 relative to water). The BHI of CAF+CE was not significantly reduced in either the men or women at this timepoint.
3
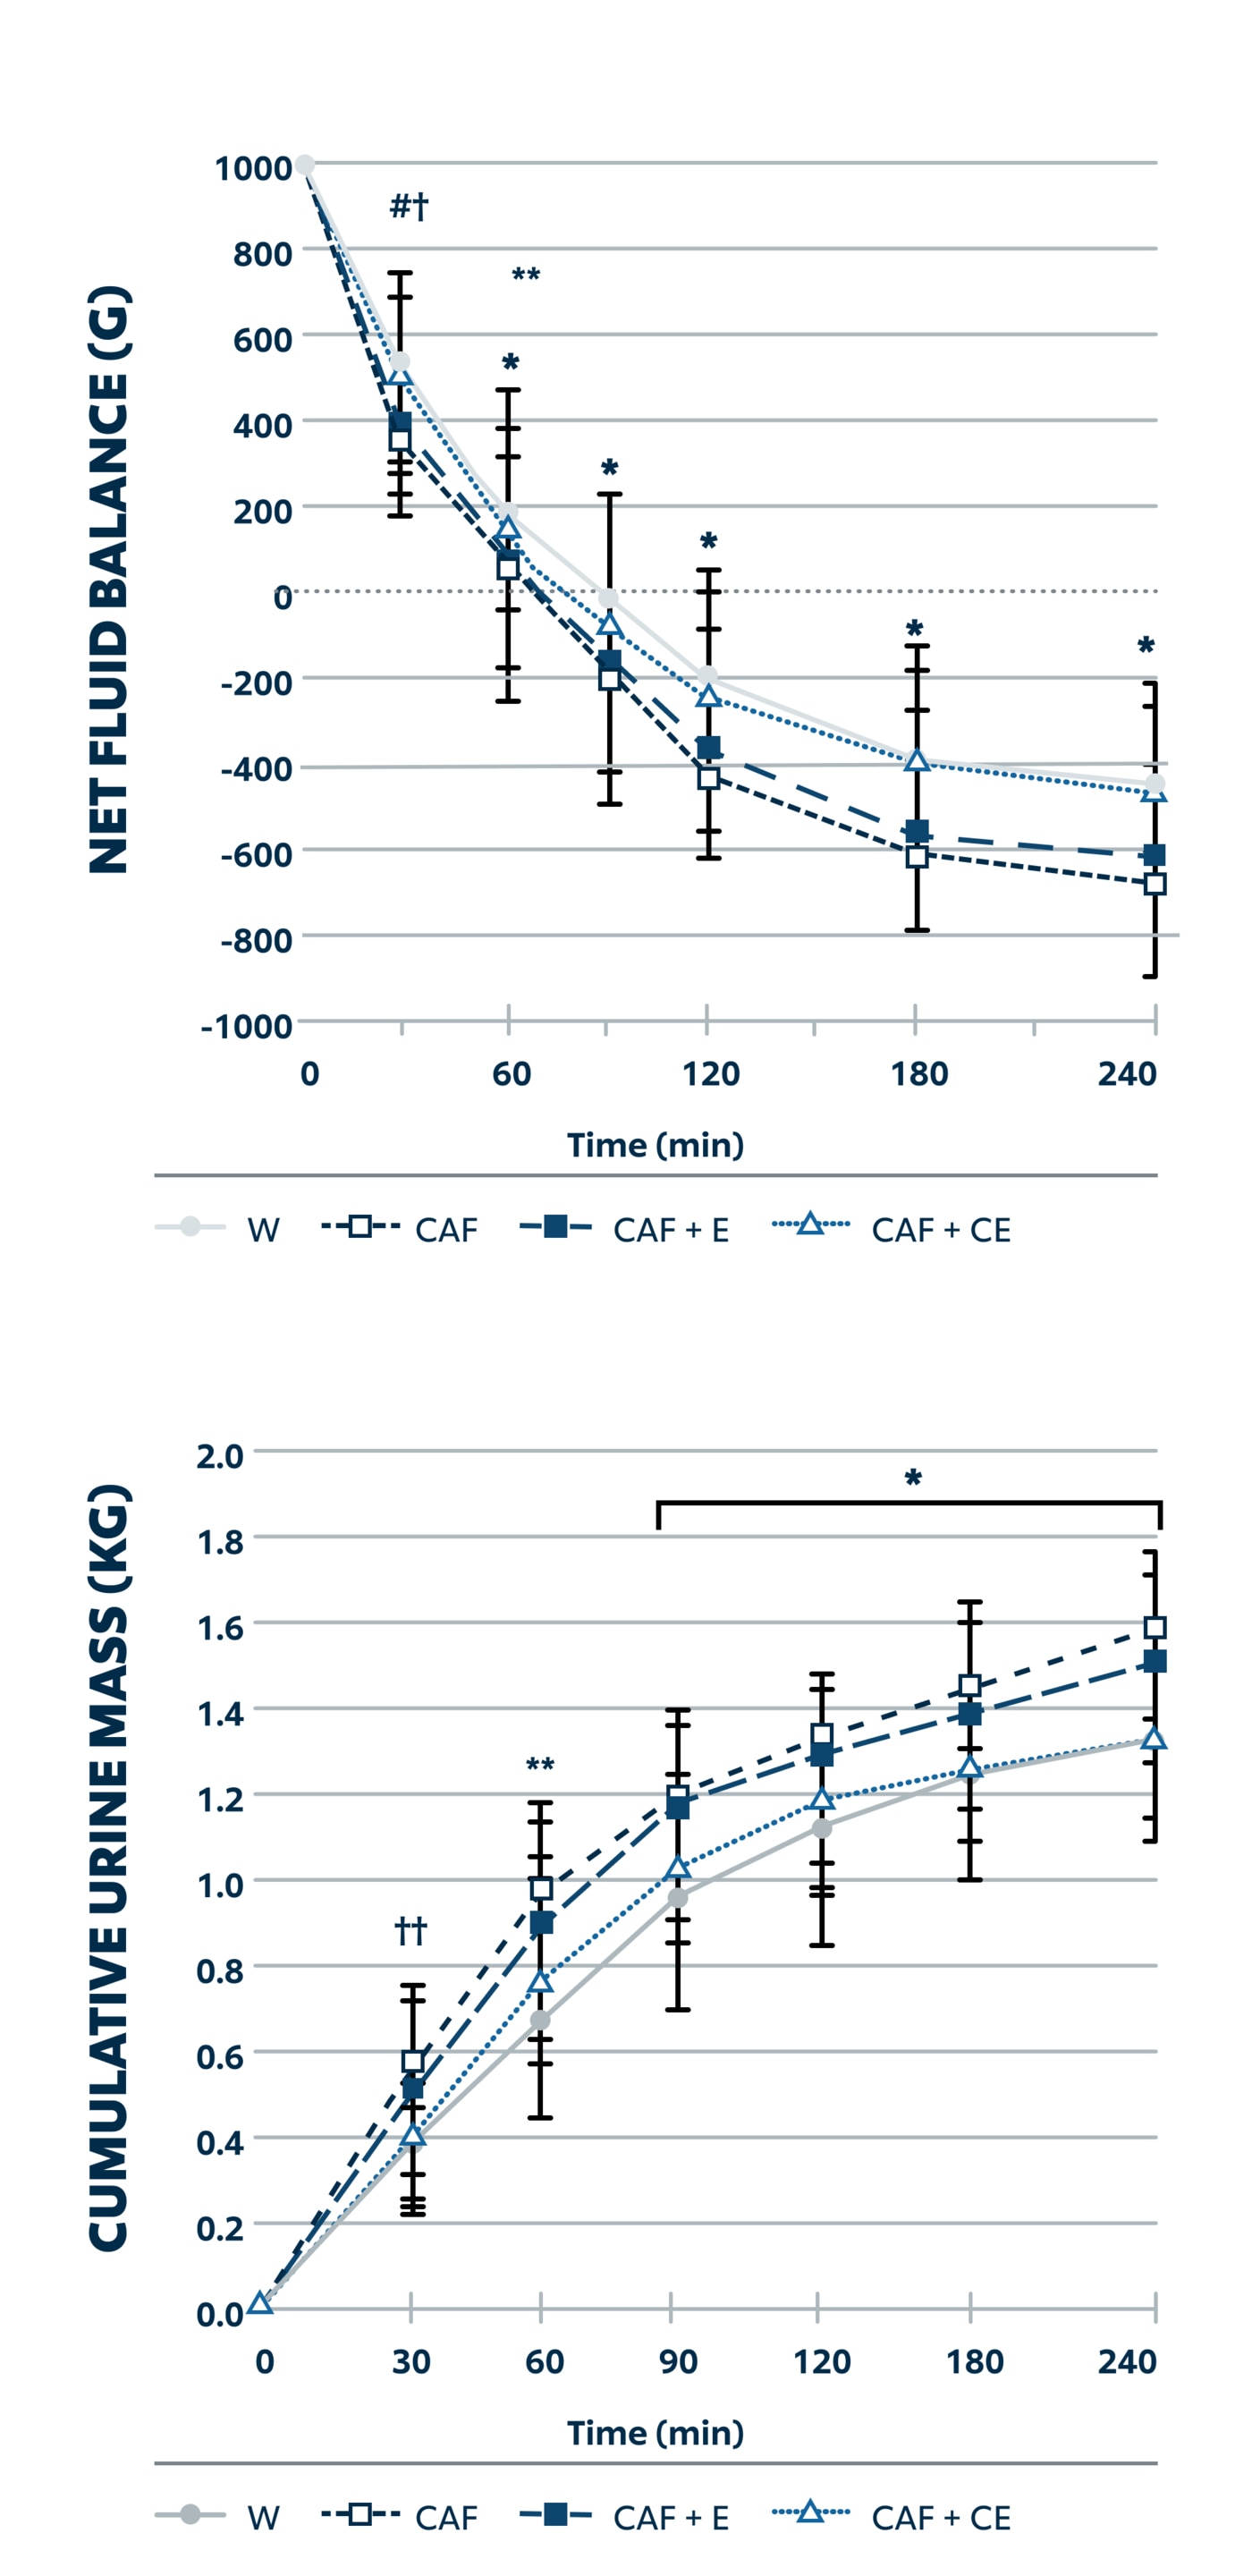
Net Fluid Balance: At the 60-minute timepoint, water exhibited a superior net fluid balance relative to all other test beverages (P<0.05). From 90 minutes onwards, CAF+CE also exerted a more positive net fluid balance compared to CAF and CAF+E (P<0.05).
Cumulative Urine Mass: Water and CAF + CE averaged a more positive fluid balance (P<0.001, P<0.001) compared to CAF and CAF + CE, ranging from a 120 to 175 mL greater overall fluid balance.
Hydration measurements for the four tested beverages. Top: Net fluid balance. Bottom: Cumulative urine mass. † CAF+CE > CAF (P = 0.05) and †† Both water and CAF+CE > CAF at 30 min. * Water and CAF+CE different than CAF and CAF+E (P<0.05). ** Water > all beverages (P<0.05). Adapted from Millard-Stafford et al., Caffeinated Energy Drink Formulations Differentially Impact Hydration Versus Water: Does Habitual Caffeine Intake or Biological Sex Matter? Nutrients (2025), 17, 2913.
4
Sex Effect of Urine Mass: Men and women exhibited different diuretic responses to the caffeinated drinks, compared to water. At 120 and 240 minutes, consumption of water and CAF+CE resulted in significantly less urine output relative to CAF (P<0.001) and CAF+E (P<0.001). In contrast, no differences in urine output among the four beverages were detected in women except in CAF+CE which was less than CAF (P=0.007) and CAF+E (P=0.015) at 240 minutes.
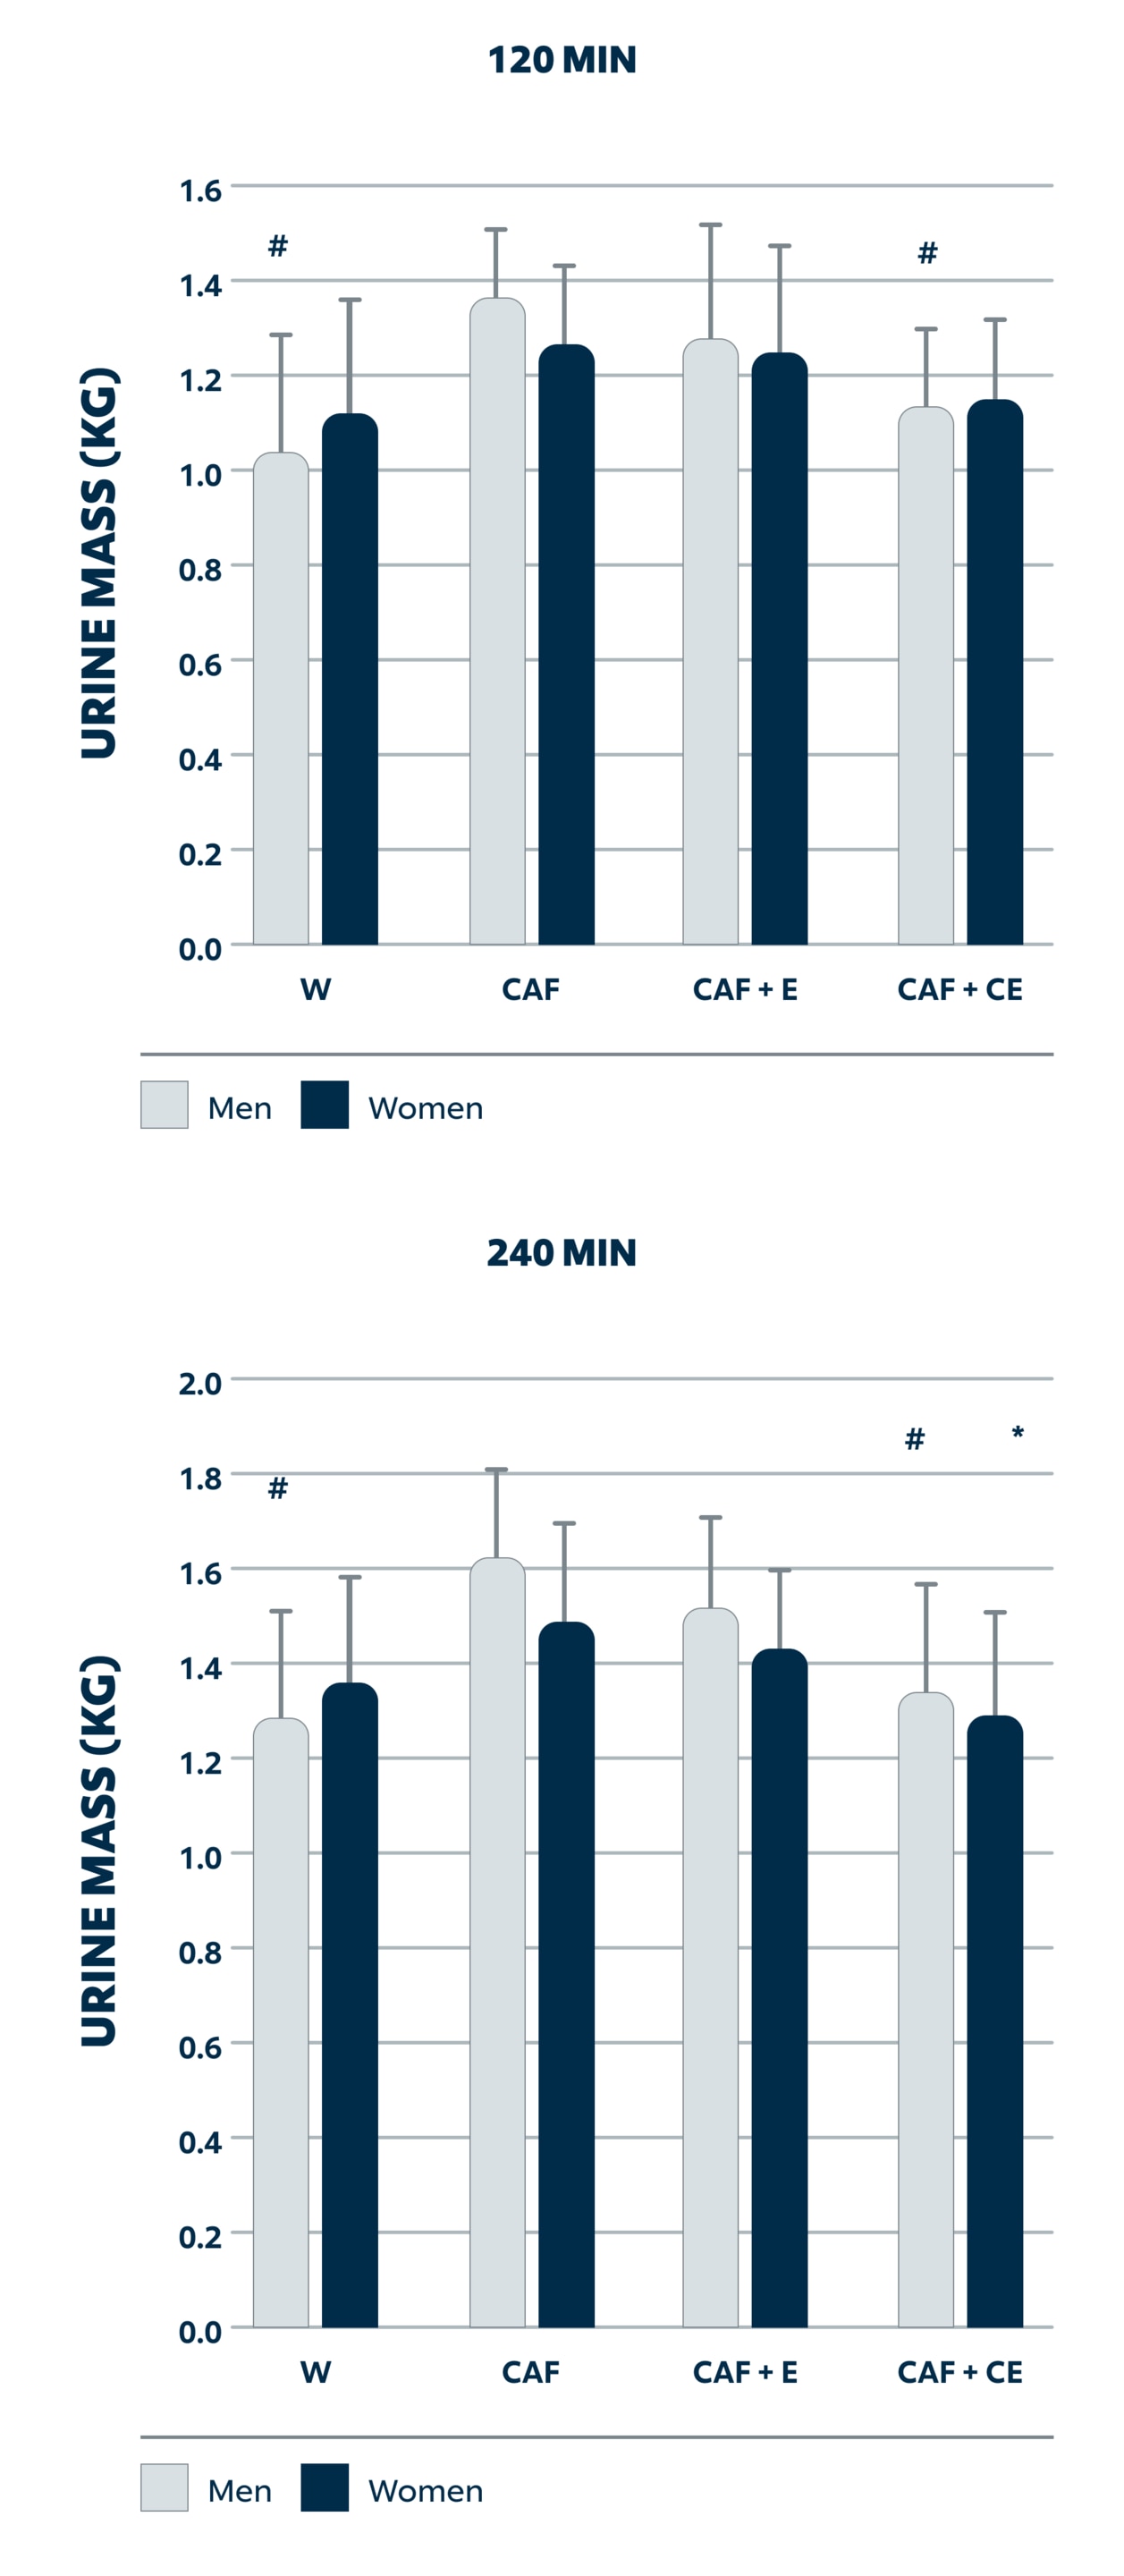
Urine mass for men and women. Left: 120 minutes. Right: 240 minutes. # Water and CAF+CE < CAF and CAF+CE (P<0.05 in men). * CAF+CE < CAF and CAF+CE (P<0.05 in women). Adapted from Millard-Stafford et al., Caffeinated Energy Drink Formulations Differentially Impact Hydration Versus Water: Does Habitual Caffeine Intake or Biological Sex Matter? Nutrients (2025), 17, 2913.
5
Urine Osmolality: Consumption of water resulted in significantly lower urine osmolality relative to CAF+CE and CAF+E at 2 hours (P=0.005 and P=0.001 respectively) and at 3 hours (P=0.010 and P=0.038, respectively). At the 4-hour timepoint, water was only lower than CAF+CE (P=0.005).
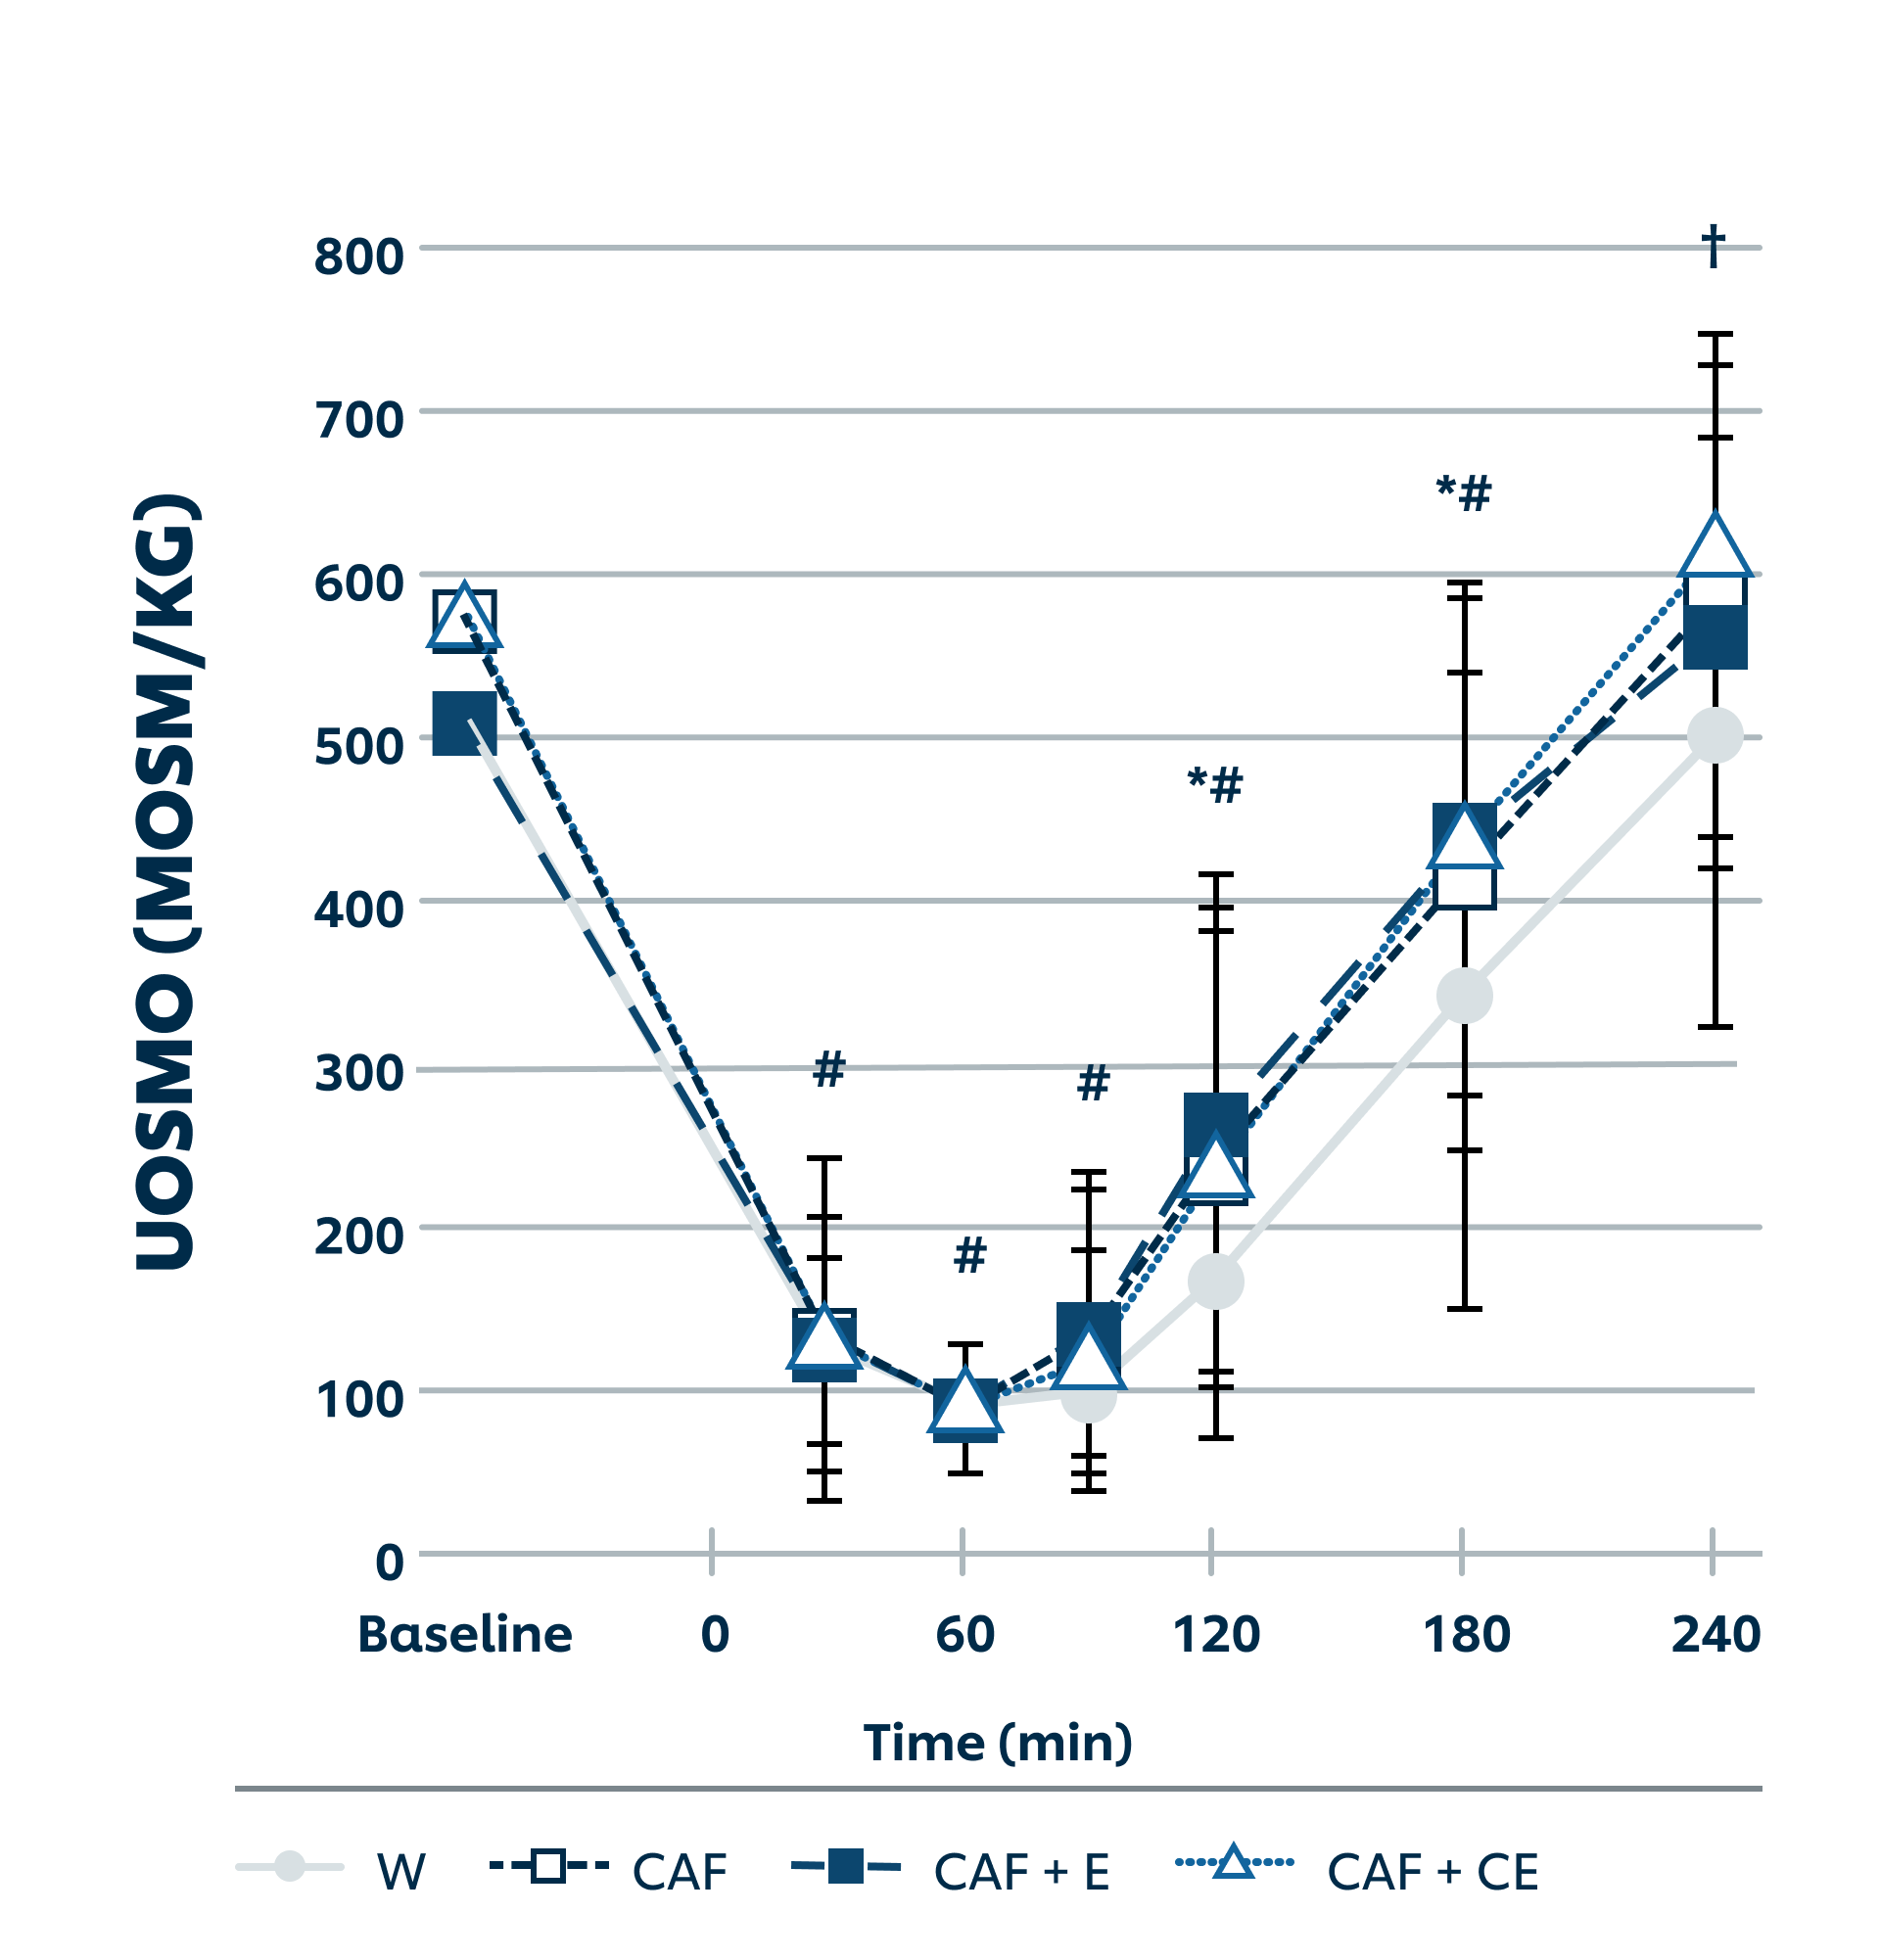
Urine osmolality for the four tested beverages. * Water < CAF+CE and CAF+E (P<0.05). † Water < CAF+CE (P=0.005). # Baseline > 30, 60, 90, 120, and 180 min (P<0.02). Adapted from Millard-Stafford et al., Caffeinated Energy Drink Formulations Differentially Impact Hydration Versus Water: Does Habitual Caffeine Intake or Biological Sex Matter? Nutrients (2025), 17, 2913.
6
Effect of Habitual Caffeine Intake on BHI: Habitual intake status has no effect on Beverage Hydration Index between the naïve and habitual caffeine user groups, averaged across all three caffeinated beverages over 120 and 240 minutes.
Access Journal
More research pages like this

- slide 1
- slide 2
- slide 3
- slide 4
- slide 5
- slide 6
THESE STATEMENTS HAVE NOT BEEN EVALUATED BY THE FOOD AND DRUG ADMINISTRATION. THIS PRODUCT IS NOT INTENDED TO DIAGNOSE, TREAT, CURE OR PREVENT ANY DISEASE.
This information is provided as a medical and scientific educational resource for the use of dieticians and other licensed healthcare professionals. This information is intended for Practitioners to use as the basis for determining whether to recommend these products to their clients. All recommendations regarding protocols, dosing, prescribing and/or use instructions should be tailored to the individual needs of the client considering their medical history and concomitant therapies. This Information is not intended for use by consumers.
What are you looking for?



© 2025 Unilever.
All rights reserved